One thing we are discovering as we work through our emerging vision of an effective differentiated math program to meet the needs of all learners in our intermediate classrooms is that a centers-based approach -- while excellent in meeting a wide variety of learning needs -- cannot be the sole experience for students or their teachers.
Much as I love me a good buffet, a nice full-serve dinner once in a while is not to be shunned!
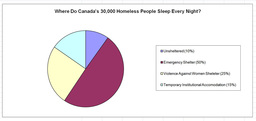
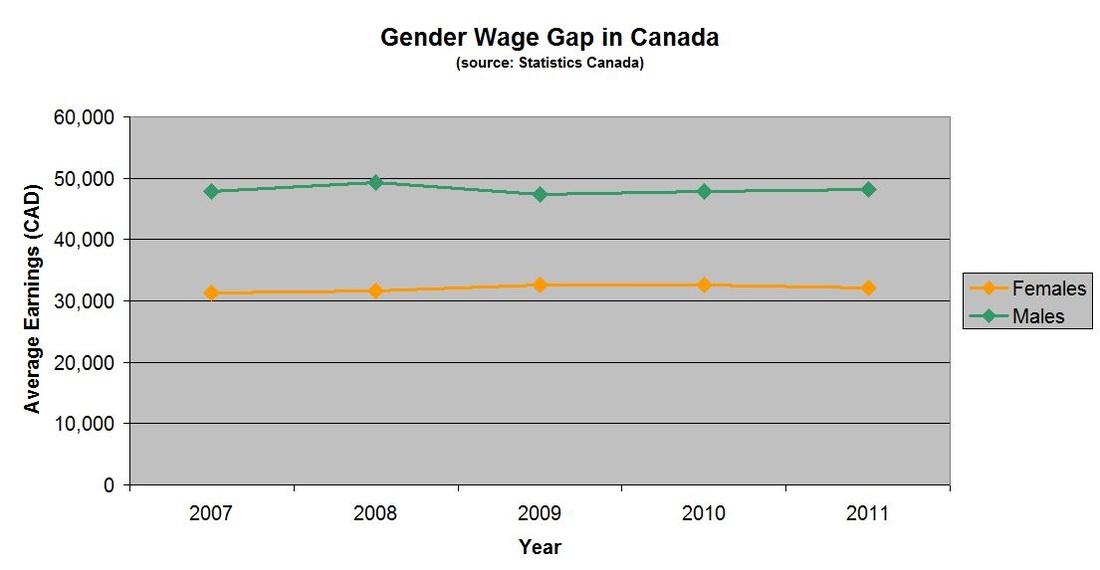
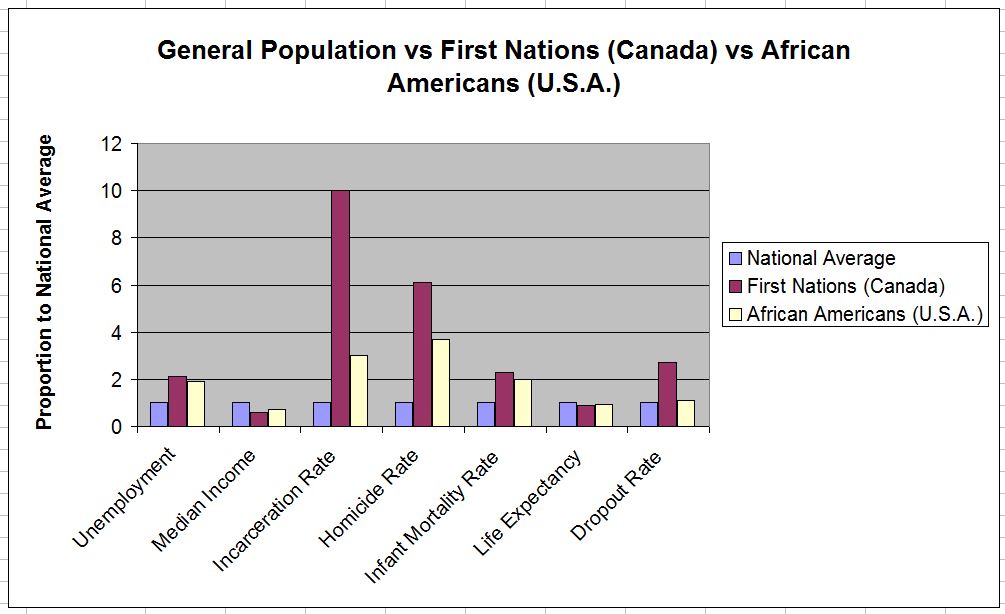
And so, my instructional coach and I recently set out to develop a more teacher-guided data management unit for my grade 7 and 8 classes. With a renewed focus on social justice and equity coming from the Board and Ministry, and the understanding that intermediate students overwhelmingly are attracted to "fairness", we decided to use real life data (about homelessness, gender gaps in pay, racism, LGBTQ issues, etc.) to hook the students.
Much as I love me a good buffet, a nice full-serve dinner once in a while is not to be shunned!
And so, my instructional coach and I recently set out to develop a more teacher-guided data management unit for my grade 7 and 8 classes. With a renewed focus on social justice and equity coming from the Board and Ministry, and the understanding that intermediate students overwhelmingly are attracted to "fairness", we decided to use real life data (about homelessness, gender gaps in pay, racism, LGBTQ issues, etc.) to hook the students.
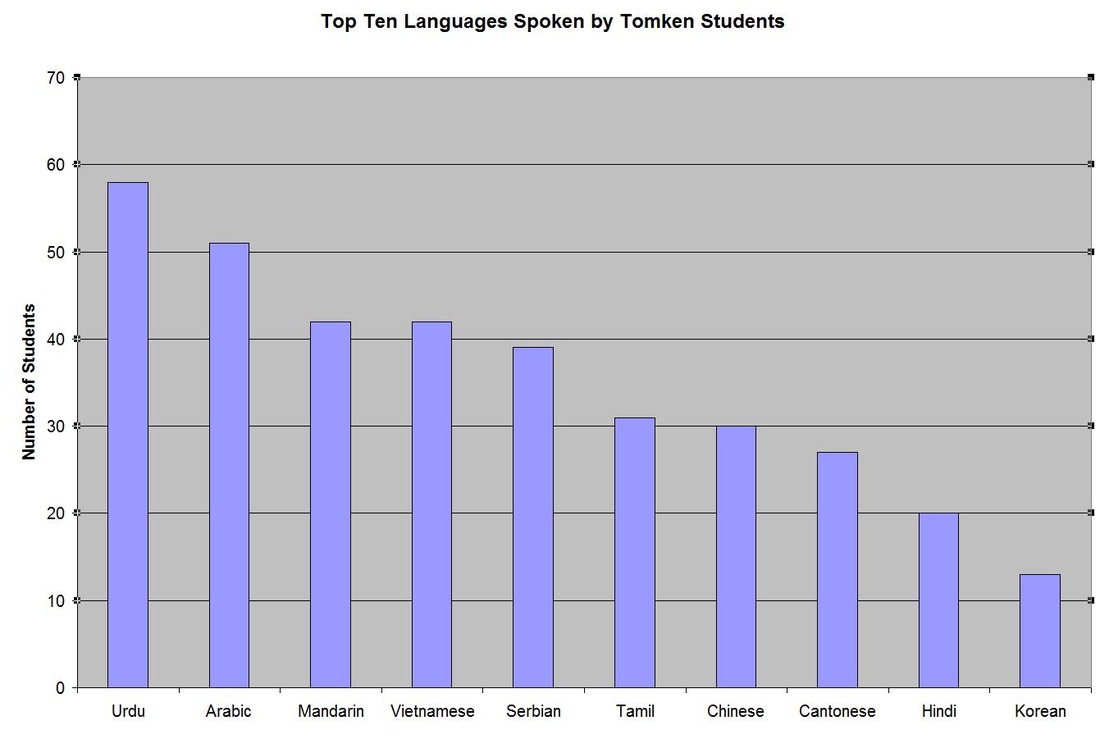 |  |  |
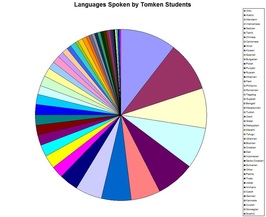
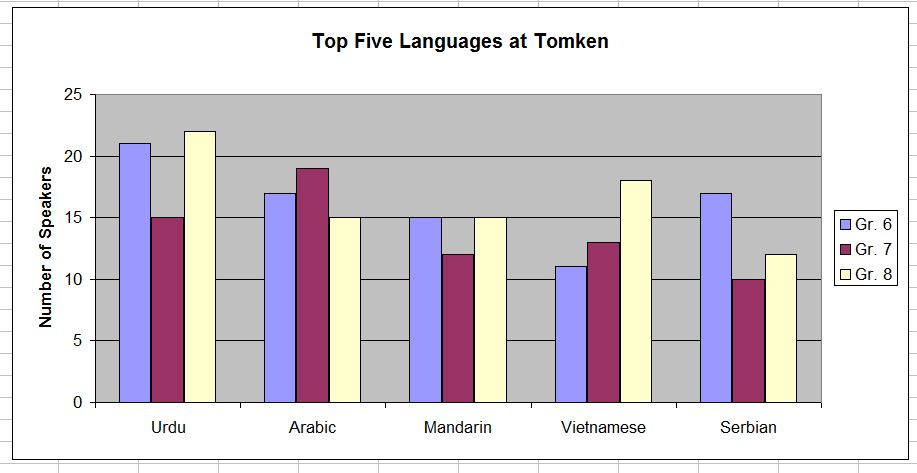
In addition to finding raw data online and in the news, we also used stats from our school, for example, the number of families who speak a language in addition to English at home, and what those language are. We hope this will allow for an excellent discussion about graphs in the media, how we use data, and which types of graphs are more effective in different situations and why.
 |  |
We began with my Grade 8s this past week, and a colleague at another school is using our material with her Grade 7s (I'll begin with my own grade 7s the week after next, once my measurement unit is done and my student teacher has left).
Gr 7 Success Criteria & Diagnostic, completed by a colleague at another school who is test-driving our unit.
The flow of the unit is basically this: First there is a hook to get students thinking about data, and how it might be time to move beyond favourite colour and snack food (one lesson for Grade 7 includes an examination of clothing labels in the classroom, and where many of the clothes we wear are made -- this data is then turned into a circle graph and ethical and economic implications discussed.)
Then we perform a little diagnostic to see what they already know about data and graphing, and we develop a vocabulary list and anchor charts about the different types of graphs. This is followed by a series of lessons on relative frequency (mean, median and mode), with a focus on how calculating "average" in different ways and/or leaving out or even slightly modifying one piece of data can impact the overall result.
Next it's on to media examples of data tables and charts (we're using the recent Maclean's article on Canada's racism problem!) and how one might best graph such data. Students will also get a teacher-directed mini lesson on either pie charts and double line graphs (Grade 7) or histograms and scatter plots (Grade 8), and then teach about whichever graph they focused on to a student from the other group before applying their knowledge to turn raw data into one of these types of graphs. There is also be a lesson on bias; this will include designing fair survey questions, and considering how data can be manipulated to serve various purposes.
In addition to classroom observation and a few exit tickets, students will show what they know through a quiz and a culminating task. The latter has students considering an issue they want to research, designing a fair survey to collect primary data from a representative sample, then displaying said data on two different types of graphs, and developing an argument that can be justified using the data.
The unit overview, nearly complete, but still somewhat a work in progress, is below. Following that I have uploaded selected power points and student files. A quiz is still forthcoming, and questions will be linked to each success criteria.
The unit overview, nearly complete, but still somewhat a work in progress, is below. Following that I have uploaded selected power points and student files. A quiz is still forthcoming, and questions will be linked to each success criteria.
| 1_-_intro_purpose_homelessness_esl_tomken_graphs.pptx |
| 2_-_types_of_graph,_purpose.pptx |
| 4_-_canada's_race_problem_-_modeled_turning_data_into_graphs.pptx |
| 5_-_student_application_-_turning_data_into_bar_graphs.pptx |
| 6_-_two_types_of_graphs_gr_7.pptx |
| 6_-_two_types_of_graphs_grade_8.pptx |
| 7_-_turning_data_into_graphs.pptx |
Selected Student Files and BLMS
| 1_-_homework_gr_8.docx |
| 3_-_the_negotiator.docx |
| 4_-_mccleans_article_on_race_problem.docx |
| 5_-_raw_data.docx |
| 6_-_grade_7_circle_graphs_and_double_line.docx |
| 6_-_grade_8_scatterplots_and_histograms.docx |
| 7_-_raw_data_for_double_line_graphs,_pie_chart,_scatterplots,_histograms.docx |
| 7_-_math_skills_grade_7_self_assessment_and_homeworkdocx.docx |
| 10_-_challenge_questions.docx |
Assessment and Evaluation
A big struggle for me this year has been managing all the paperwork associated with rotary classes in a way that allows me to meaningfully track learning and communicate student progress effectively to families, while still maintaining the sorts of records necessary for the dreaded report card writing drama that unfolds at the end of each term.
For this unit I've created and will experiment for the first time with a tracking form that allows me to record progress for each individual student. I've been reluctant to do this in the past, preferring to track marks and observations for an entire class on one page, but I have come to see that the limitation of such a tool are too great, and so I'm going to try out the following sheet (Grade 7 template below, both grades also posted to the right as Word doc files).
By numbering students' papers alphabetically (the big square in the top right), I am hoping to more easily find and manage the papers for all 120 students I see.
| |
Across the top of the sheet are the success criteria, which students will have the opportunity to demonstrate through a variety of assignments. Each assignment will be assessed and checks recorded on the student sheet in a different colour, so that one can easily see when a student demonstrated each criterion and to what extent. | ||||
These observations will form the basis of the final report card comment, which then translates into a letter grade/anchor percentage.
This unit marks for me several new directions: I am team-planning and team-teaching in greater depth and breadth than I ever have previously. I am experimenting with new assessment/evaluation tracking tools while consolidating a bank of assessment strategies (in addition to anecdotal observations gleaned from conferences and while students are working in class, I will also collect data using exit tickets, homework completion, a quiz and their culminating task... and students will also complete a mid-point self assessment based on the learning goals and success criteria as well as the growth mindset exit ticket I have them complete for each math unit). I also finally feel like I am effectively combining "real" math with authentic, real-world social justice application that moves beyond the superficial we often do our best to pay lip-service to.
As students engage with the data and critically examine both the math and their own internal biases, will their thinking evolve, and will they become stronger statisticians?
Only time (and my new tracking form) will tell!
Enjoyed this unit? Using it in your classroom? We're so pleased! We'd love to hear back from you on how it's going, and what changes you recommend. Feel free to comment below and/or contact Vera to share your ideas and resources.
This unit took hours and hours of our personal, after-hours time to research and develop. We don't like using TPT because it leave the work inaccessible to those who may need it most. But if you are in a position to do so, why not consider a donation? Even $5 is appreciated! We'll use it for snacks while we work, or for one of my other projects.
This unit took hours and hours of our personal, after-hours time to research and develop. We don't like using TPT because it leave the work inaccessible to those who may need it most. But if you are in a position to do so, why not consider a donation? Even $5 is appreciated! We'll use it for snacks while we work, or for one of my other projects.

 RSS Feed